AJE is excited to share that the Office of Special Education Programs (OSEP) at the US Department of Education has published the 2021 Annual Report to Congress on the IDEA. This report gives people an understanding of how students with disabilities are doing across the country, not just in DC. Readers can also use this report to see how DC compares to other jurisdictions. The information below is from OSEP.
Earlier this month, OSEP announced the release of the 43rd Annual Report to Congress on the Implementation of the Individuals with Disabilities Education Act, 2021. The report focuses on children with disabilities being served under IDEA, Part B and Part C, nationally and at the state level. It provides an overview of IDEA Section 618 and 616 data.
What Does the Data Tell Us?
Percentage of Students with Disabilities Exiting School, Ages 14 through 21, by Race/Ethnicity, Served Under IDEA, Part B, in the US, Outlying Areas,
and Freely Associated States: SY 2018–19
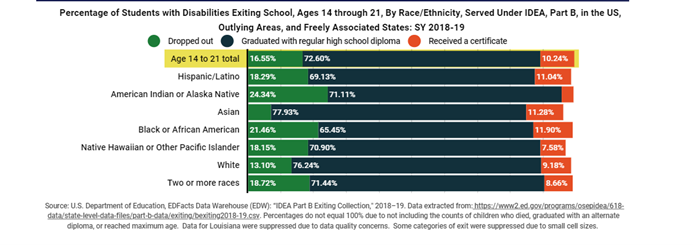
Consider:
- Look at the first row. This row demonstrates the percent of all students with disabilities exiting school by dropping out, graduating with regular high school diploma, or receiving a certificate.
- Now look at the other rows. These rows present students with disabilities exiting school by race/ ethnicity.
- Compare the first all students with disabilities row to the different racial/ ethnic rows.
- What differences do you find? What is the magnitude of those differences?
For more information on racial/ ethnic breakdowns, please see the OSEP Fast Facts: Race and Ethnicity of Children with Disabilities Served under IDEA Part B.
For additional thought-provoking data questions and conversation starters, please see the accompanying Hand in Hand supplemental tool.
Leave a Reply