The Office of the State Superintendent recently released their State of Discipline Report for the 2019-2020 school year. Please note that due to the COVID-19 public health emergency, which led to remote instruction across the District, this report includes data through March 13, 2020. Through this report, the Office of the State Superintendent of Education (OSSE) fulfills local reporting requirements and provides the public with transparent data on school discipline. The data included in this report satisfies local reporting requirements, specifically the Pre-K Student Discipline Amendment Act of 2015 and the Student Fair Access to School Act Amendment of 2018 (more information on the Fair Access Act / SFASA HERE). As noted above, this report includes data through March 13, 2020 and explores the comparative rates of exclusion for different student groups, so it is not impacted by the smaller number of overall incidents due to a shorter data collection period.
This blog post goes into more detail about the report, shares some of the key findings, and highlights of the report. This post references the pages numbers of the discipline report that are discussed in parenthesis (pg. #) throughout the post so readers can find that information easily.
Disciplinary Action Breakdowns: who, what, why, and how many?
What: The State of Discipline Report discusses out of school suspensions (beginning on pg. 7), in school suspensions (beginning on pg. 19), involuntary dismissals (beginning on pg. 24), and expulsions (beginning on pg. 25). Out-of-school suspensions are still the most frequently reported disciplinary action in the District of Columbia (pg. 7). Local law defines in-school suspension as “temporarily removing a student from the student’s regular class schedule as a disciplinary consequence, during which time the student remains on school grounds under the supervision of school personnel who are physically in the same location as the student.” Involuntary dismissal is defined as “removal of the student from school attendance for less than half of a school day for disciplinary reasons, during which time the student is not under the supervision of school personnel and is not allowed on school grounds.” An expulsion is defined as the removal of a student from the student’s school of enrollment for disciplinary reasons for the remainder of the school year or longer in accordance with LEA policy.
How Many: “During the 2019-20 school year, 3,605 students received a total of 5,213 out-of-school suspensions. That is, roughly 3.6 percent of the student population in the District of Columbia received an out-of-school suspension in the 2019-20 school year” (pg.7). This is a decrease from the previous years, as 6,073 students received out of school suspensions in the 2018-19 school year. With this being said, it is important to note that the data from the 2019-20 school year was smaller to begin with due to COVID-19. A total of 1,033 students received an in-school suspension during the 2019-20 school year (pg.19). LEAs reported 160 instances of involuntary dismissals during the 2019-20 school year, which occurred at 23 schools across 5 LEAs (pg. 24). A total of 53 students were expelled across 16 LEAs and 24 schools during the 2019-20 school year (pg. 25).
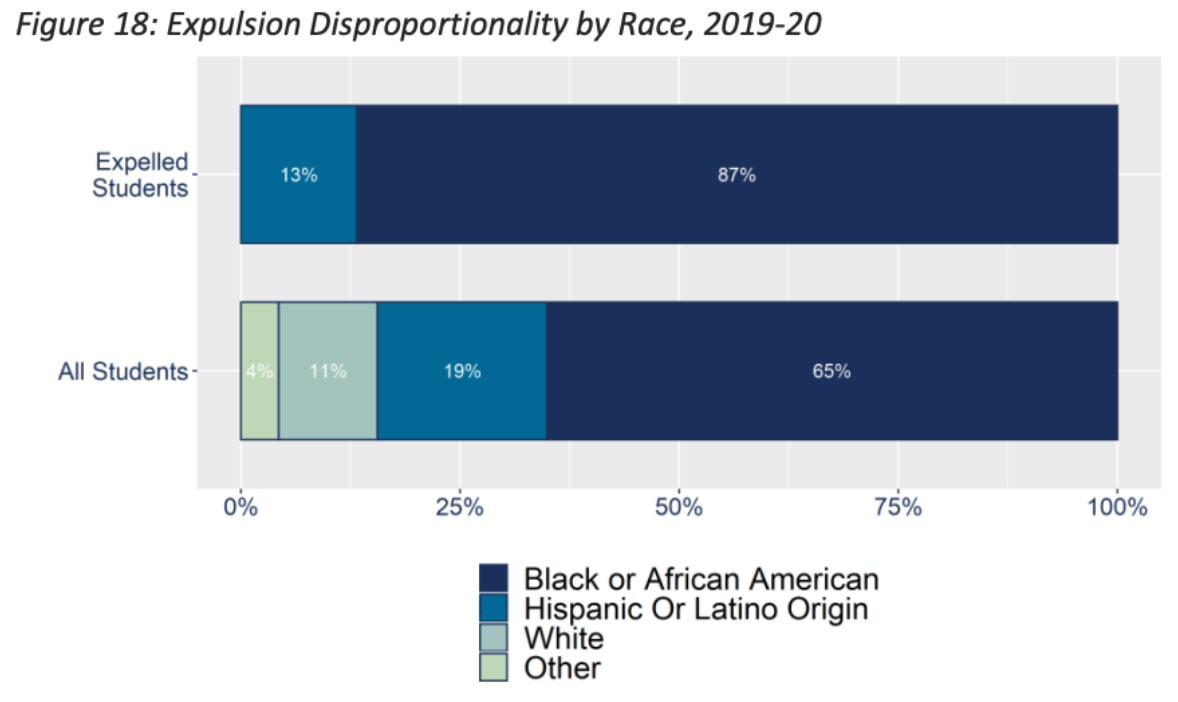
Who: Black or African American students were disproportionately represented among disciplined students, especially those receiving more than one out-of-school suspension. Black or African American students make up 65% of the District’s student population but 89% of out-of-school suspensions. Controlling for all other student demographics, Black or African American students were four times more likely to receive an out-of-school suspension than White students in the District, which is consistent with the findings of previous years (pg. 13). Black or African American students represented 82 percent of students who received an in-school suspension while making up only 65 percent of all District students (pg. 33). Additionally, 98% of students that received involuntary dismissal during the 2019-20 school year were Black or African American students (pg. 24). Black or African American students and at-risk students were over-represented among expulsions, as well (demonstrated below in Figure 18). Black or African American students accounted for 87% of expulsions in the 2019-20 school year, while representing 65% of the total D.C. student population (pg. 25).
At-risk students make up 48% of the District’s student population but 70% percent of the disciplined population. Specifically, at-risk students were 1.6 times more likely to receive at least one out-of-school suspension as students who were not at-risk when controlling for other student demographics in the 2019-20 school year (pg. 15). At-risk students (76%) were over-represented in the students who received an involuntary dismissal during the 2019-20 school year (pg. 24). Students who were identified as at-risk received 62% of all expulsions, while only accounting for 46% of the total student population (pg. 25). This data illuminates the need for increased support for students who experienced homelessness in the 2019-20 school year, are in foster care, qualify for TANF or SNAP, or are high school students who are one year or older than expected age for their grade.
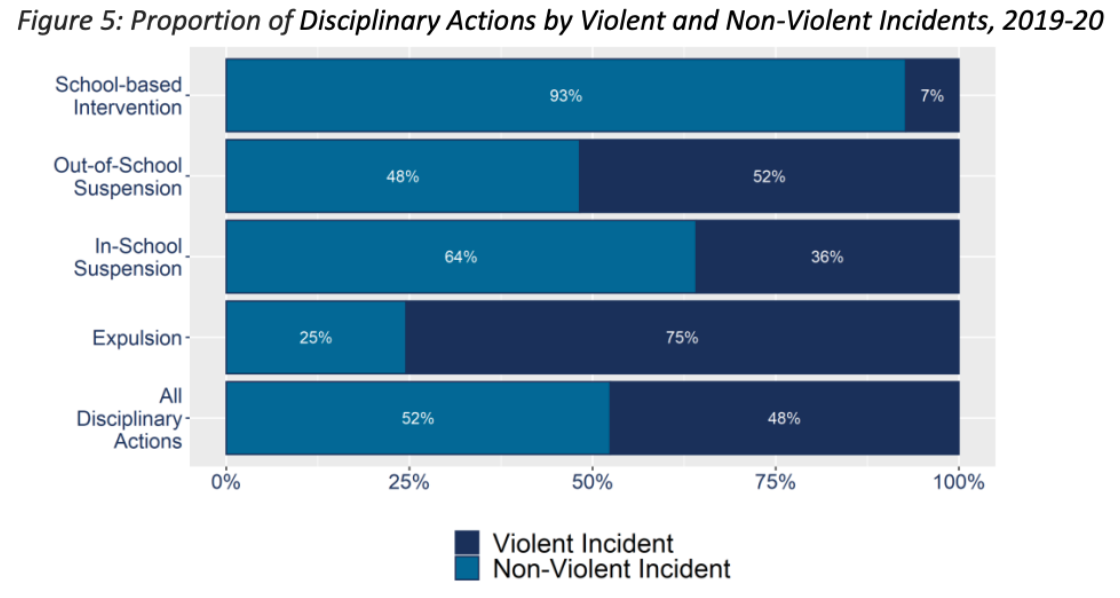
Why: More than 60% of out-of-school suspensions resulted from fighting or disruptive/reckless behavior (pg. 9), but each local education agency (LEA) sets its own definition for disruptive/reckless behavior. The sentiment expressed by AJE in our review of the 2018-19 State of Discipline Report still rings true, “This lack of consistency makes it unnecessarily difficult to accurately identify and then resolve the largest disciplinary challenges that DCPS faces.” OSSE found 48% of all disciplinary actions were a result of a violent incident, more details pictured below in Figure 5 (pg 11). OSSE refers to incidents of violence as including the following behavioral offenses: sexual assault, robbery with and without a weapon, fight with and without a weapon, threats of physical attack with and without a weapon, possession of a firearm or explosive device, and use of a firearm or homicide. In the 2019-20 school year, more than half of in-school suspensions were a result of disruptive/reckless behavior or fighting. There were 322 instances of disruptive/reckless behavior and 310 instances of fighting, which led to an in-school suspension (pg. 21). During the 2019-20 school year, 75% of expulsions were due to an incidence of violence (pg. 25).
Focusing on Students with Disabilities:
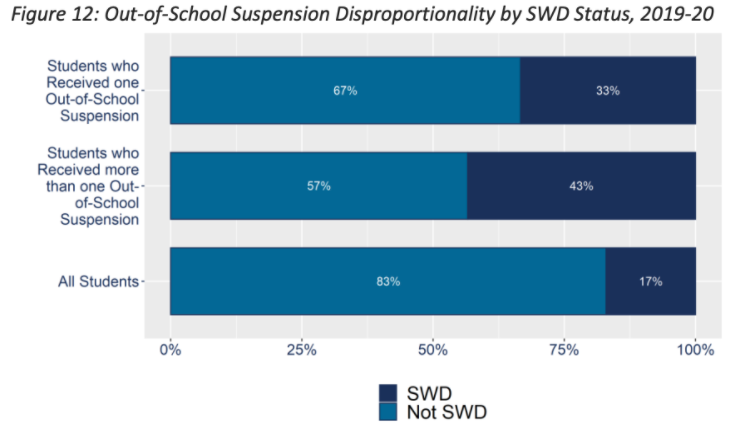
Overall, students with disabilities were overrepresented across each disciplinary action. They accounted for 34 percent of students who received an in-school suspension, 30 percent of expulsions, and 30 percent of involuntary dismissals in the 2019-20 school year (pg. 27). In the 2019-20 school year, students with disabilities were nearly twice as likely to receive at least one out of school suspension as students who were not identified as having a disability, controlling for other student demographics. As pictured below in Figure 12, students with disabilities made up 33% of the suspended population, despite representing only 17% of the total student population (pg. 18).
Among the population of students with disabilities, students with emotional disturbance are three times more likely to receive an out-of-school suspension compared with students with other primary disabilities when controlling for all other student demographics.
Conclusion:
As demonstrated by the data in this report, school discipline remains inequitably distributed across District students. Black or African American students, at-risk students, and students with disabilities continue to be overrepresented in disciplinary actions and have been overrepresented for many years. The solution to actions that require discipline is not denying those students access to education through exclusionary measures. Furthermore, the report states “OSSE is exploring challenges and best practices in supporting positive behavior amongst students with disabilities” (pg. 28), but there is no elaboration on the result of their efforts and only three pages of the report were designated for discussion on students with disabilities. AJE hopes a greater emphasis will be put on addressing these disparities in a productive and healthy manner in the future.
Leave a Reply